Reports
Reports
You can use the reports section of cockpit to display custom statistics and reports. Please note that this section is not visible if no report is available. Refer to the Cockpit Plugins section for adding a custom reporting plugin.
Process Instance Duration Report
 Process Instance Duration Report
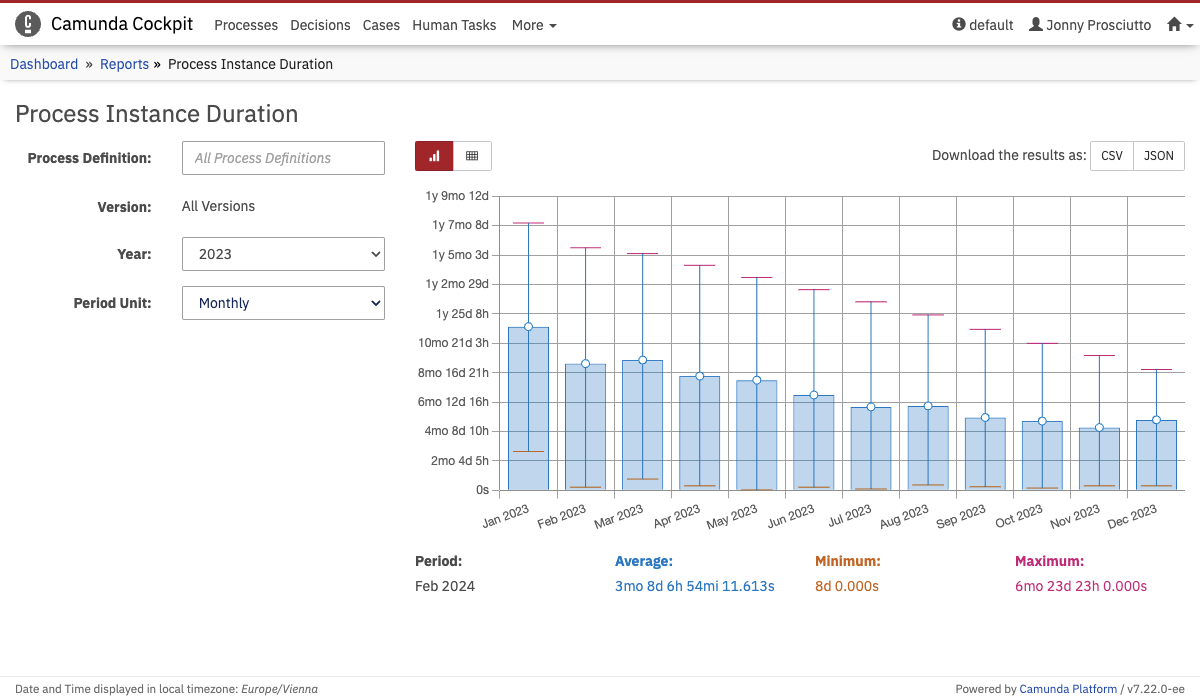
This report shows the average, minimum and maximum duration for a selected process definition and version for a given timeframe. Monthly and quarterly aggregation of the duration times are supported. You can hover over a bar in the bars chart to see the exact values below the chart. You can also switch to the table view to see the exact values for every month or quarter.
Pressing the download buttons above the chart triggers the export of the results in CSV or JSON format.
Completed Task Instance Report
 Historic Task Instance Report
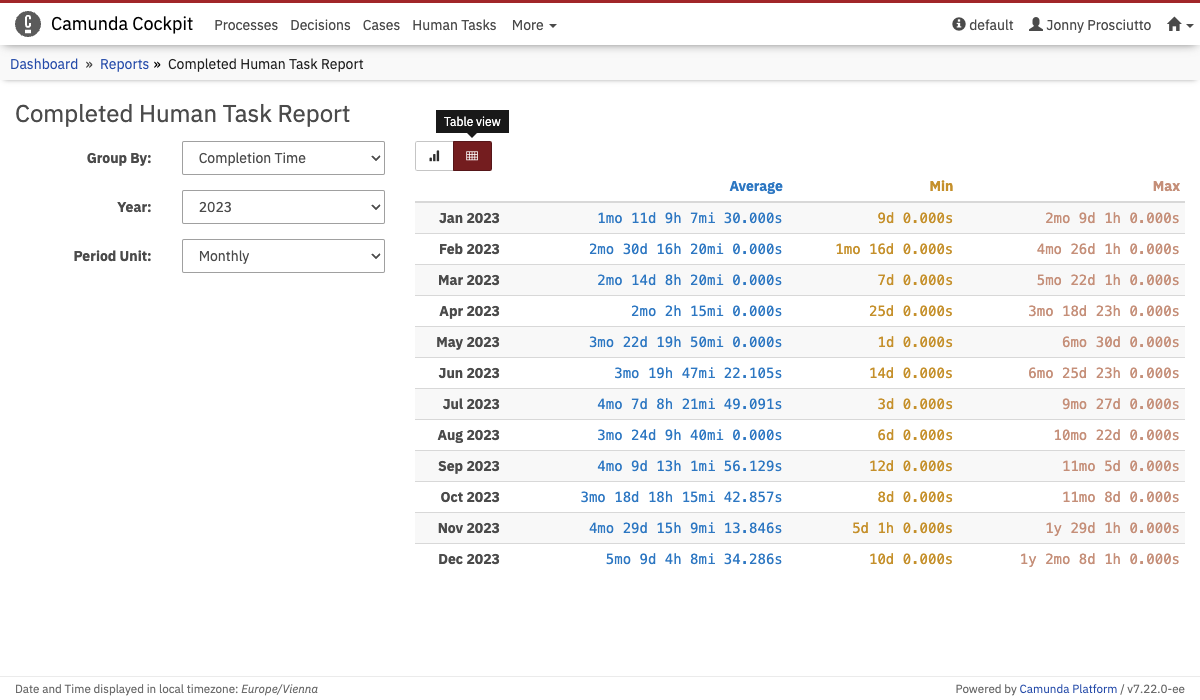
This report contains two types of report. There is a completed tasks report which shows all tasks which are completed within a given timeframe. It is possible to group these tasks by task definition key or by process definition key.
The second report is a duration report for completed tasks. The report will be shown if you choose the group by completion time option. This report shows the average, minimum and maximum duration of all completed tasks for a given timeframe. Monthly and quarterly aggregation of the duration times are supported. You can hover over a bar in the bars chart to see the exact values below the chart. You can also switch to the table view to see the exact values for every month or quarter.