Dashboard
 Cockpit Dashboard
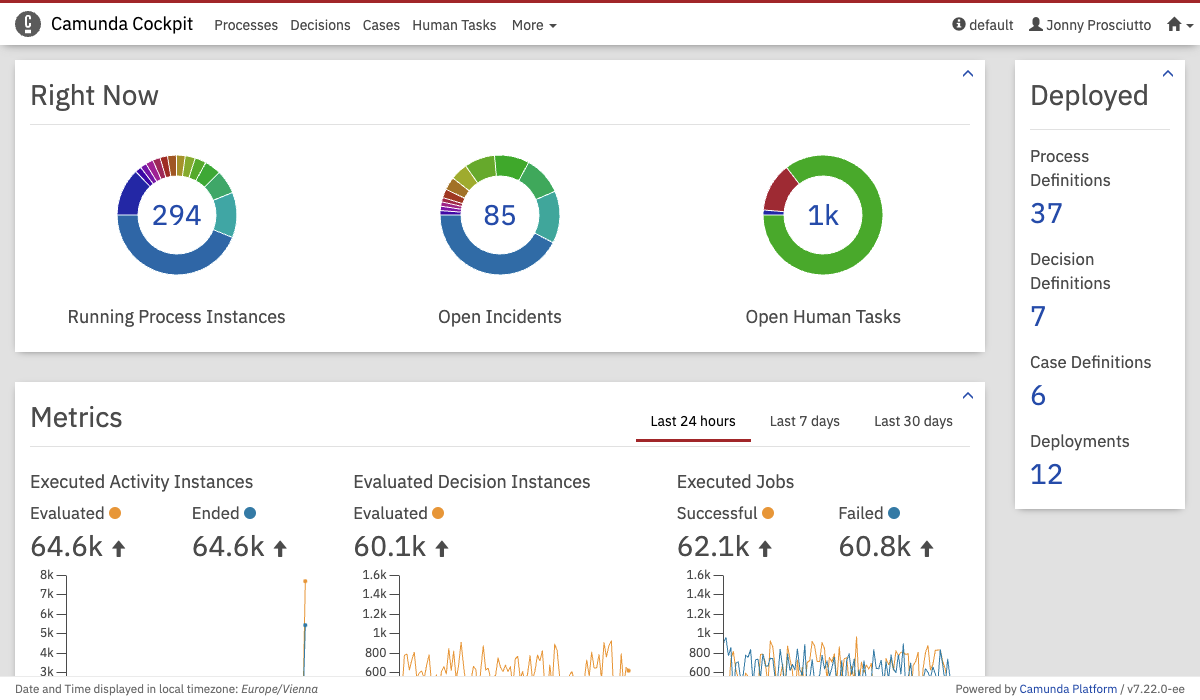
The Cockpit dashboard provides a quick overview of running and historic operations as well as details about deployments.
At the top of the dashboard, you can see a plugin with pie charts that display the number of running process instances, open incidents, and open human tasks. Click the number or a section of the pie chart to open the corresponding search with preselected query parameters.
On the right-hand side, you see an overview of deployed process definitions, decision definitions, case definitions, and the total number of deployments.
Additional plugins can be added to the dashboard.
Metrics
 Cockpit Dashboard Metrics
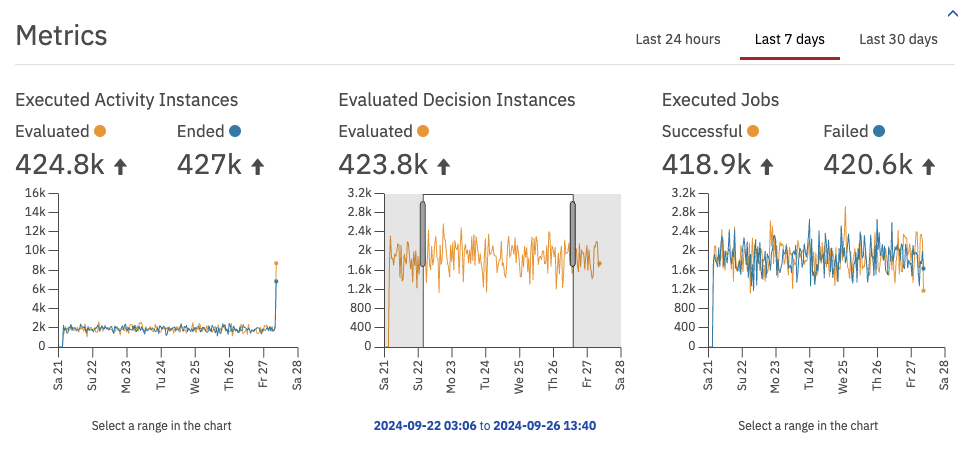
At the bottom of the dashboard, the metrics plugin displays graphs with metrics for executed activity instances, evaluated decision instances, and executed jobs. You can choose to display the details for the current day, the current week, or the current month. Click the metrics graphs and drag the cursor in either direction to select a specific time range. You can also modify the time range by using the mouse wheel. Click the link that appears under the graph to open the corresponding search with preselected query parameters.
Multi Engine
 Multiple Engines
If you are working with more than one engine, you can select the desired engine via a drop-down selection. Cockpit provides all information for the selected engine.